

Blog statistics don’t have to be a dirty word and secret cloaked in mystery. In a lot of ways, book blogging is a lot of shouting into the void and hoping others find your content. We are left comparing our own success with what we think other blogs are doing, and I think a lot of new book bloggers give up as a result. That’s why I like to share my statistics and some insights in an annual Stats Transparency Post and encourage others to share as well!
2023 Stats Transparency was made available to Reader Voracious patrons early with a more in-depth analysis! Patrons support me and receive early post access, the ability to make requests, and more perks for as little as $2 a month!
This post isn’t meant to be a “How to Grow Your Blog” guide, but my goal is to promote open discussion about statistics. As can be expected from Reader Voracious, this post is full of statistics, charts, and delicious data!
Why Stats Transparency?
I think it is important to normalize talking about statistics within our blogging niche, as well as remove the stigma surrounding sharing statistics, and agree with what Vicky says in her 2018 post that initially inspired me:
But ultimately, I believe that the book community is a community in need of a lot more transparency. For authors and publishers, I know this is a lot more difficult, but for bloggers–we control our platforms. Not anyone else. In the end, my blog is my blog and I can give insight to other bloggers by sharing this information (even if it feels so awkward).
Briana @ Pages Unbound does a biennial survey to demystify “average” book blog stats and consistently 50% of respondents report 50 views or less a day on average. Check out 2022’s results and stay tuned for the next survey in 2024.
Reader Voracious’ growth isn’t typical: I know how very fortunate I am to have the platform that I do and how anomalous it is within the community. As always, I’m anxious to share my statistics because I don’t want to make anyone feel bad or for it to look like I’m bragging, but I feel strongly that transparency is key and I hope that the insights I share from my own analysis help you determine things you might be able to incorporate if you want to grow your own blog.
Reader Voracious Statistics for 2023
Reader Voracious turns six years old tomorrow (I can’t believe it!) and 2023 was the best year yet for the blog 🎉
Posts
Visitors
Views
For the first time, Reader Voracious surpassed 100,000 views in a year! As always, my annual free Book Blogging Spreadsheet Template is responsible for a good amount of that traffic, but a number of my posts doing very well via search: only 3 of my top 25 posts viewed in 2023 were published last year, showing how evergreen our blogs are and will bring search traffic for years to come.
📊 Need help tracking your statistics? Download the FREE Ultimate Book Blogger / Reader Spreadsheet Template!
Reader Voracious Statistics Year Over Year
One of the valuable insights comes from the statistics year over year. You are able to see trends easier with more data points, and ultimately that is why I decided to share my statistics publicly. Reader Voracious went self-hosted in June of 2019 and the below screenshot reflects the view breakdown since then.

Reader Voracious had 21,507 views in 2018 and 24,859 views in 2019 prior to being self-hosted.
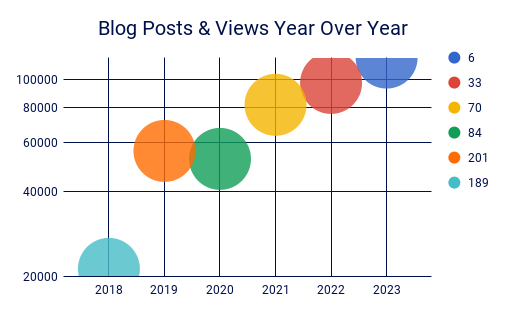
Over the last six years, my posting frequency has decreased drastically (245 posts in my first year, though some are now deleted) while my views have gone up which highlights that it isn’t necessarily about the quantity of posts published.
🎉 Related Post: Evergreen Content and Book Bloggers. Learn why book reviews consistently perform better months and years after publication.

The Reader Voracious follower statistics are an important data point to me because it truly highlights how important blog hopping and engaging in the community is. Reader Voracious experienced explosive growth during its first two years thanks to my blog hopping routine. The past couple of years I haven’t had the bandwidth for hopping beyond commenting back and that is reflected in my overall follower count. Reader Voracious’ growth has plateaued since I stopped engaging within the book blogging space frequently.
🎉 Related Post: Why I Switched to Feedly for Blog Hopping. Check out this resource about ways to keep up with your favorite blogs!

Key Takeaways
60.22% of last year’s traffic came from Search Engines and 92% of the Top 75 posts were published prior to 2023. This is the second year where my stats reflected such a huge skew for search traffic, which is in line with when I started paying attention to Bare Minimum SEO.
📊 Need help with SEO? Check out my Free Guides in the SEO Basics series!
One thing that I want to specially highlight is how amazing SEO is for book bloggers. Book reviews, lists, and discussions continue to receive traction months and years after initial publication. Social Media posts like Instagram and BookTok aren’t indexed by search engines, so blog posts continue to receive traffic if optimized well.
💡 Related Post: Why Book Blogs Are Relevant & Valuable Marketing Tools
Lastly, blog hopping and engaging with other book blogs is critical to gaining an audience. Search traffic has not translated in new followers or increased post engagement in my case, but then again I do not currently have an active newsletter and mailing list. It’s possible that there would be more converts if I did, but that’s something for me to explore later!
Additional Reading
Before wrapping up, I’d like to highlight other book bloggers who share their blogging statistics with their own Stats Transparency posts. If you’ve got one of your own please let me know so I can check it out and add it here!
- Soph @ Bookwyrming Thoughts: 2023 Book Blogging Stats Transparency

💖 If you like the work that I do here at Reader Voracious, consider fueling my pumpkin spice latte and black tie addiction by buying me a ko-fi or joining my Patreon! ☕
Let’s Chat!
Thank you for being here and please drop in the comments to say hello, share your recent post, and ask any questions you might have.
This post is brought to you by the Reader Voracious patrons. Please take a moment to check out their content!
Haley • Bex • Vicki • Lauren • Davida • Liz • Nicole • Jen • Bethany • Sam • Cshover • Vernaida • Venus • Yvonne • Amanda • Caro


I love posts like this!! Thanks for sharing and congratulations on surpassing 100,000 views!
I loved seeing your blogging statistics and reflections, it was really interesting! ❤️ I don’t look at my stats much, but sometimes I think it might be better to pay a bit of attention to them!
I love this kind of post so much, thank you for the transparency, it’s always so interesting to read! I’m just like you in terms of SEO traffic not translating into interactions and comments on the blog itself. I’ve been… well, a little slow at blogging in the past few months and, while my traffic is still consistent thanks to SEO, obviously, since I haven’t been blog hopping a lot, my engagement is very low.
Thanks for this wonderful post! I hope you’ve been well, sending you love xxx
i really loved this a lot <3 i think…. i might do this too, because it really is important. and my gosh go evergreen reviews really make alllllll the difference. i hope you are well, sweet friend <3